Embracing Historical Patterns
In the realm of trading, history often serves as a guidepost for the future. Technical indicators rooted in historical data offer valuable insights into potential market trends. Among these indicators, the golden cross pattern stands out as a beacon of opportunity for traders seeking to navigate the unpredictable waters of the market with confidence.
Understanding the Golden Cross
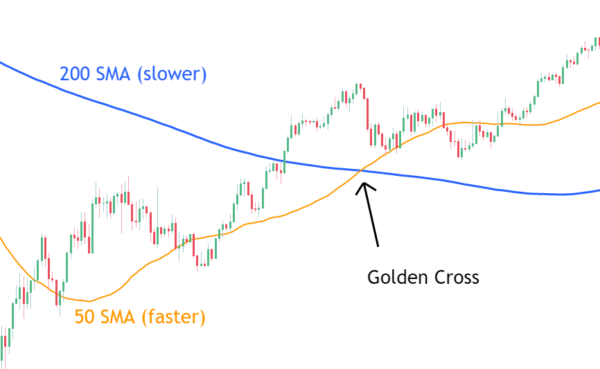
The golden cross pattern is a revered trading strategy based on chart patterns in technical analysis. It manifests when a security’s short-term moving average ascends above its long-term moving average on a trading chart, heralding an imminent uptrend in the market. Recognizing this pattern can unveil lucrative trading opportunities and position traders ahead of the curve.
Unveiling the Moving Average
Central to the golden cross pattern is the moving average—a calculated average of an asset’s closing prices over a specific period. Traders often utilize moving averages with time increments such as 50 and 200 days to gauge market trends. Longer time frames tend to yield stronger and more reliable signals, empowering traders to make informed decisions with confidence.
Interpreting the Golden Cross Pattern
The golden cross pattern unfolds in three distinct stages, each offering valuable insights into market dynamics:
- Downtrend Reversal: Following a period of selling pressure, the shorter moving average intersects with the longer moving average, signaling a trend reversal.
- Breakout Confirmation: The golden cross triggers a breakout, paving the way for a sustained uptrend characterized by higher trading volumes.
- Bull Market Ascendancy: The market experiences a prolonged uptrend, cementing the bullish sentiment and offering ample trading opportunities.
Leveraging the Golden Cross
The golden cross pattern serves as a powerful trade indicator, offering traders the following advantages:
- Identifying opportune entry and exit points in the market
- Signaling a definitive shift in market momentum towards an uptrend
- Assessing whether a stock is overbought or oversold
- Complementing other momentum indicators like MACD and RSI
- Anticipating a sustained increase in asset prices
Contrasting the Golden Cross and Death Cross
In juxtaposition to the golden cross, the death cross signals a long-term bear market, with the shorter moving average descending below the longer moving average. Both patterns serve as pivotal indicators of trend reversals, offering traders valuable insights into market sentiment.
Acknowledging the Limitations
While the golden cross pattern offers invaluable insights into market trends, it is not devoid of limitations. Traders must recognize that historical patterns are not infallible predictors of future outcomes. False signals and market volatility underscore the need for prudent risk management and a balanced approach to trading strategies.
Navigating Crypto Markets with the Golden Cross
In the realm of cryptocurrency trading, the golden cross pattern remains a widely utilized bullish indicator. However, traders must exercise caution due to the inherent volatility of crypto markets. Conducting thorough research, leveraging multiple indicators, and maintaining a disciplined approach are essential for success in crypto trading.
Conclusion
The golden cross pattern represents more than just a trading strategy—it embodies a timeless principle of technical analysis rooted in historical patterns. By mastering the intricacies of the golden cross, traders can unlock a world of opportunity and navigate market trends with confidence and clarity. So, arm yourself with knowledge, embrace prudent risk management, and embark on your trading journey with the golden cross as your guide.